

Xentara and DashSet are partnering to take test labs and machine builders from a new device to a documented result in one workflow. The DashSet AI agent connects the device to Xentara, Xentara runs it in real time on one shared timeline, and DashSet plans, approves and documents every run.
Automation is often rigid. AI and machine learning are often missing from the machine, and control logic is not always optimized with operating data.
The same connect, run, document workflow applies to the machine. The DashSet AI agent reads the documentation of a device or component and generates its connection to Xentara. Xentara executes runs in real time on one shared timeline and continuously monitors the machine, while DashSet plans, approves and documents every run.
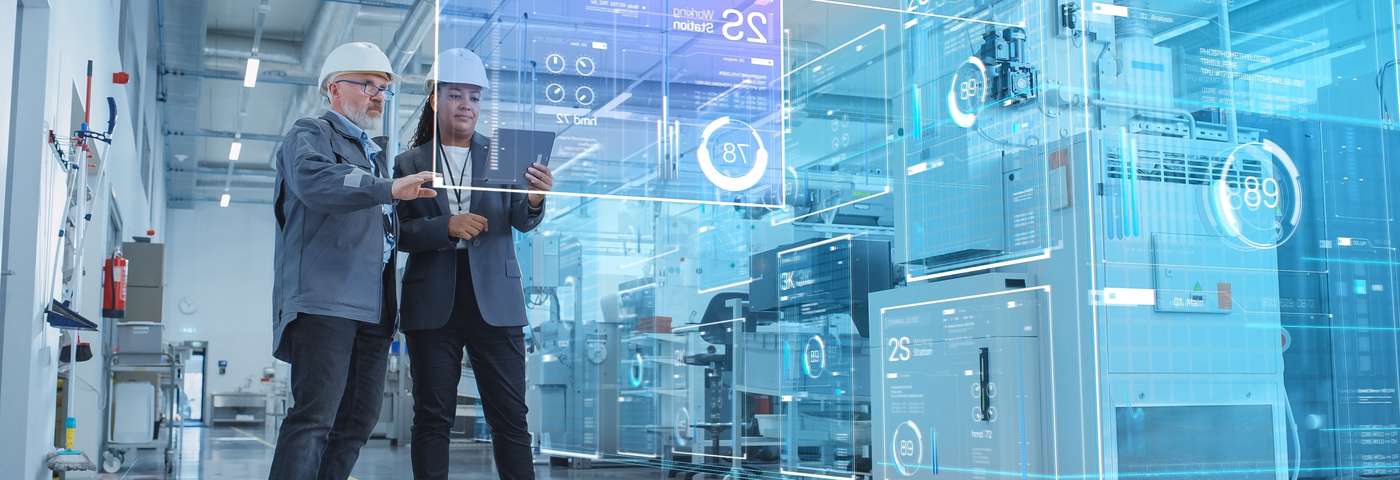
Process and condition data captured by Xentara can be used for analysis and machine learning.
DashSet uncovers relationships that conventional methods can miss. Because Xentara delivers time-consistent, high-resolution data, DashSet can also analyze real-time-critical processes in detail.
With process and condition data captured by Xentara, wear and impending failures can be detected earlier and more precisely. DashSet helps find patterns in this data and derive machine learning models. Running on Xentara, these models raise productivity and lower service costs.
Models developed in DashSet can be integrated directly into the Xentara real-time path. Control then adapts to changing material, temperature or wear and complements classic, fixed-parameter control.
Motion profiles, cycle times and travel paths are analyzed with real operating data and adjusted so that machines work faster, more gently and more precisely.
DashSet trains models on image data. Images can be linked to their process data from Xentara, which makes training data more meaningful and models more reliable.
Xentara provides real-time control, data capture and the execution of models. DashSet provides data analysis, pattern detection and the training of machine learning models.
Devices come in many types from many vendors, new devices often need manual integration, and long-term tests produce large volumes of data.
The device and the requirement decide where a test profile runs. DashSet executes standard runs itself. For real-time runs, Xentara keeps the climate chamber, the measurement system and the unit under test on one shared timeline. See how connection and handover work.
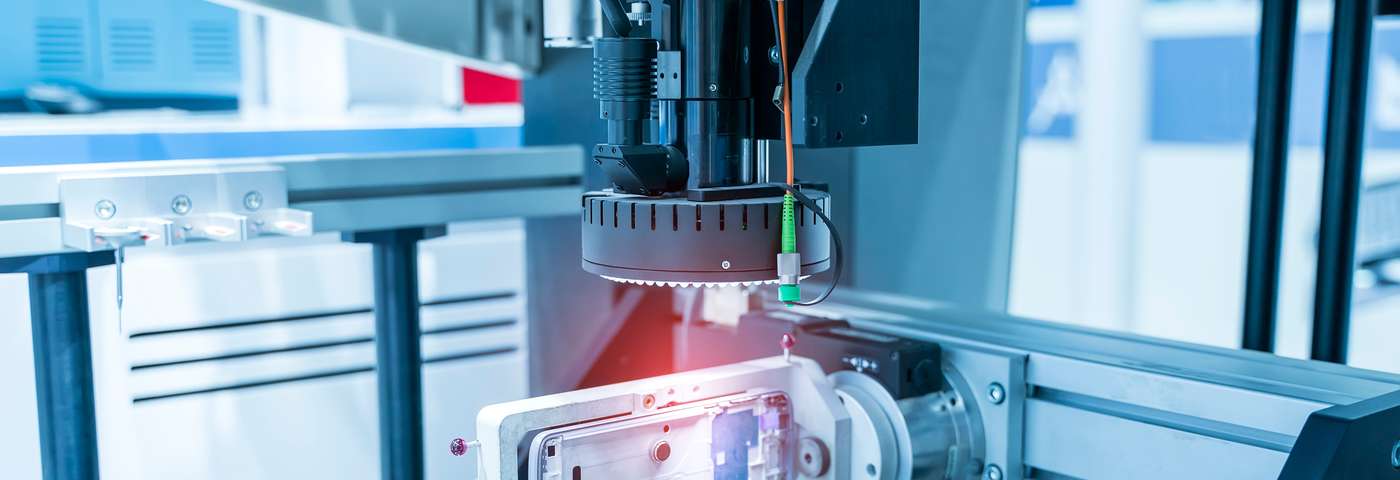
When the unit under test is connected through Xentara, failures are matched to the exact chamber conditions.
The lab defines setpoints, ramps and dwell times as a test profile in DashSet, then reviews and versions it. DashSet executes standard runs itself, directly or by handing them to the chamber controller. Where real time matters, Xentara executes the test profile.
When the unit under test is connected through Xentara, Xentara reads its signals in real time via EtherCAT, Modbus or other interfaces. A failure is detected the moment it occurs and matched to the chamber conditions. The ring buffer keeps the time window before and after the event in high resolution. Depending on the rule, Xentara halts the test, continues it or logs the event.
Limits and stops take effect immediately. Critical steps require approval in DashSet.
Profile version, setpoints and actual values, deviations, failure times with chamber conditions and the measurement data go into the audit trail and the test report. Proven test profiles can be reused for similar tests.
Each layer comes from a specialist. Operation stays the same whether a run executes in DashSet or on Xentara.
The DashSet AI agent reads the operating manual or interface description of a device and proposes its connection to Xentara. After approval, data flows. The device vendor does not need to develop anything.
Where real time matters, DashSet translates the run for the Xentara C++ interface. It generates a JSON block, inserts it into an existing base configuration and starts Xentara. With fieldbuses such as EtherCAT, the run then executes in real time.
DashSet and Xentara communicate via WebSocket, so DashSet stays connected to the run from start to finish. Evaluation logic can also be compiled as a shared library and embedded directly in Xentara.
Devices and runs on Xentara are highlighted in blue on the DashSet canvas. Otherwise they look and work like every other element in DashSet.
Both markets run on the same stack. In each market, the lead partner brings in the other.
Four steps to a measured result. You keep the choice of hardware and decide on the rollout based on that result.
Select the devices, the data and one question that matters.
Connect and synchronize the devices in real time with Xentara.
Build the analysis, models and reports in DashSet.
Decide on the rollout based on a measured result.
Get started
Email us which devices or machine components you want to connect and which question matters most. We will get back to you to scope a pilot. From a test lab? We welcome your inquiry and will connect you with DashSet, which leads the partnership for test labs.
Background: Xentara and DashSet presented their integration at SPS 2025. Read the announcement.
DashSet and other names and brands mentioned are the property of their respective owners.